

STOP SPENDING MONDAYS IN SPREADSHEETS
Does this sound familiar?
Every week you download a selling report, open Excel, and spend the next two hours manually pulling and analyzing data, flagging slow movers, and trying to build something coherent enough to bring into a meeting.
Sell Through HQ turns your raw selling reports into a complete, meeting-ready Excel workbook automatically.
WHO IT’S FOR
BUILT FOR WHOLESALE PROFESSIONALS.
You have a selling report sitting in your inbox and a meeting starting in an hour. Sell Through HQ turns that report into a complete, analysis-ready workbook before you finish your coffee. Spend less time formatting and more time knowing your business.
Jr. AE Show up to every account conversation with an analysis that looks like it took you all morning. Actually know your business, not just work on reports.
AE Own your accounts with a weekly selling summary that's ready before the first call of the week.
Sales Manager Stop rebuilding the same report structure every Monday. Run it once, use it everywhere.
Director / VP Your team moves faster when the analysis is already done. This is the tool you hand them.
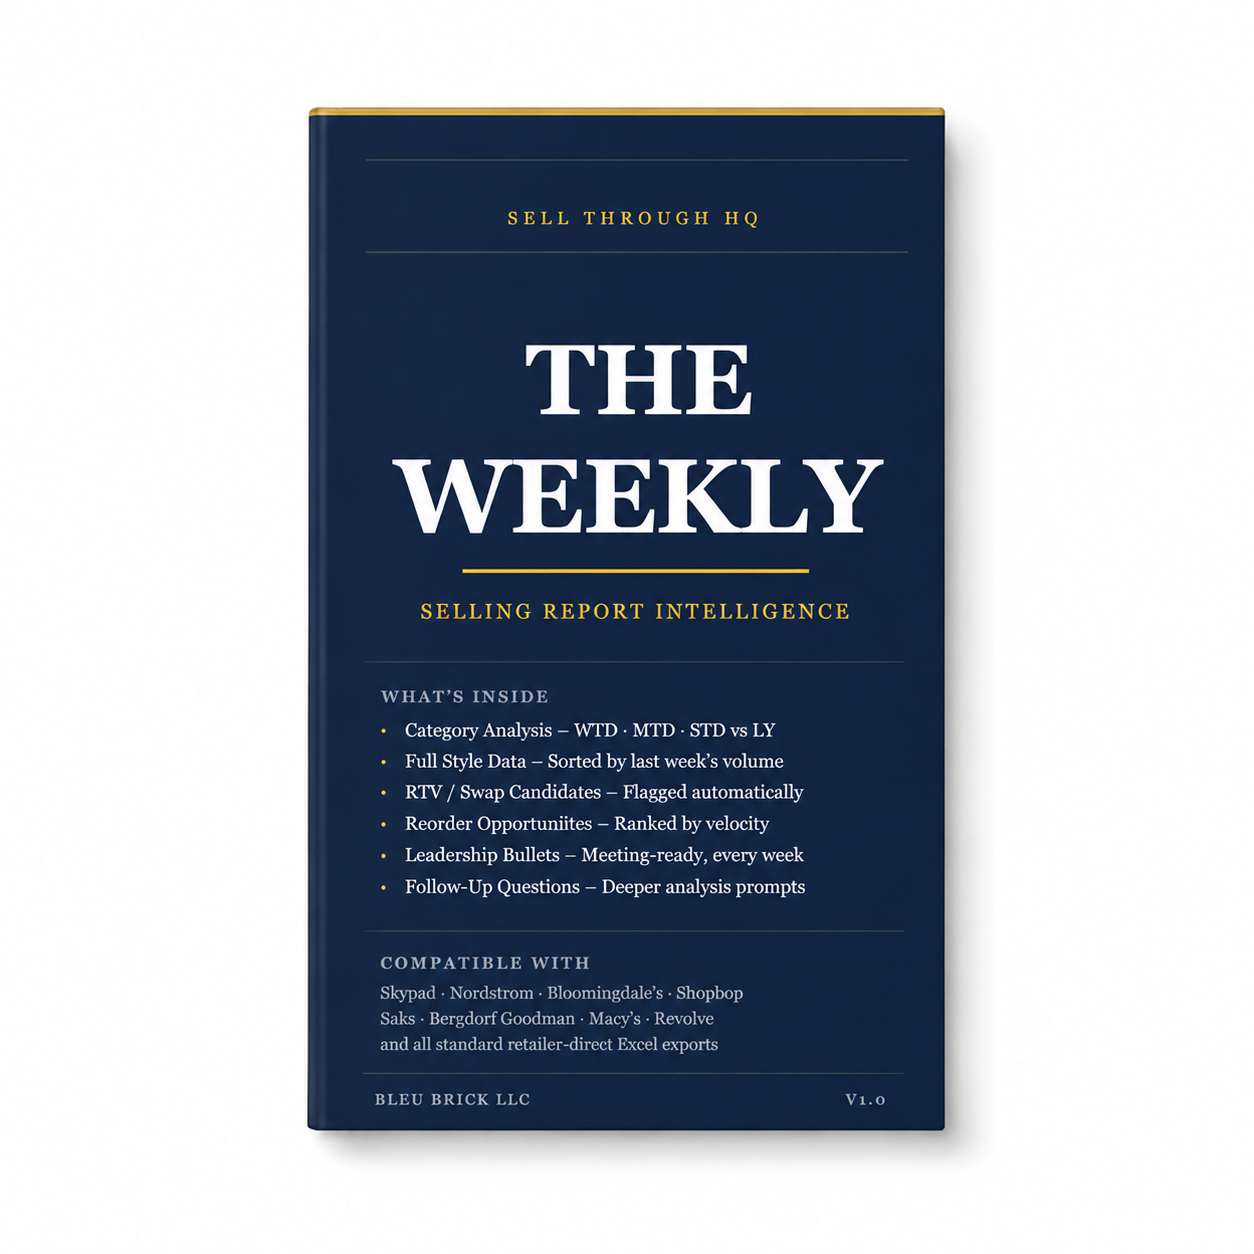
THE WEEKLY STYLE SELLING REPORT
Upload your weekly style selling and receive a complete seven-tab Excel workbook that turns raw sell-through data into category analysis, style rankings, RTV flags, reorder opportunities, and five leadership-ready bullets -- automatically.
Know what sold. Know what didn't. Know your business better and faster than ever before.
What's included:
Category Analysis -- WTD, MTD, and STD TY vs LY across all categories
Full Style Data -- every style ranked by last week's dollar volume
RTV / Swap Candidates -- slow movers flagged against real sell-through thresholds
Reorder Candidates -- high-velocity styles ranked by weekly ST% with inventory still available
Leadership Bullets -- five WTD bullets written in merchant language, meeting-ready
Follow-Up Questions -- deeper analysis prompts for color selling, SKU concentration, markdowns, and more
Requires a Claude AI account. Claude Pro recommended.
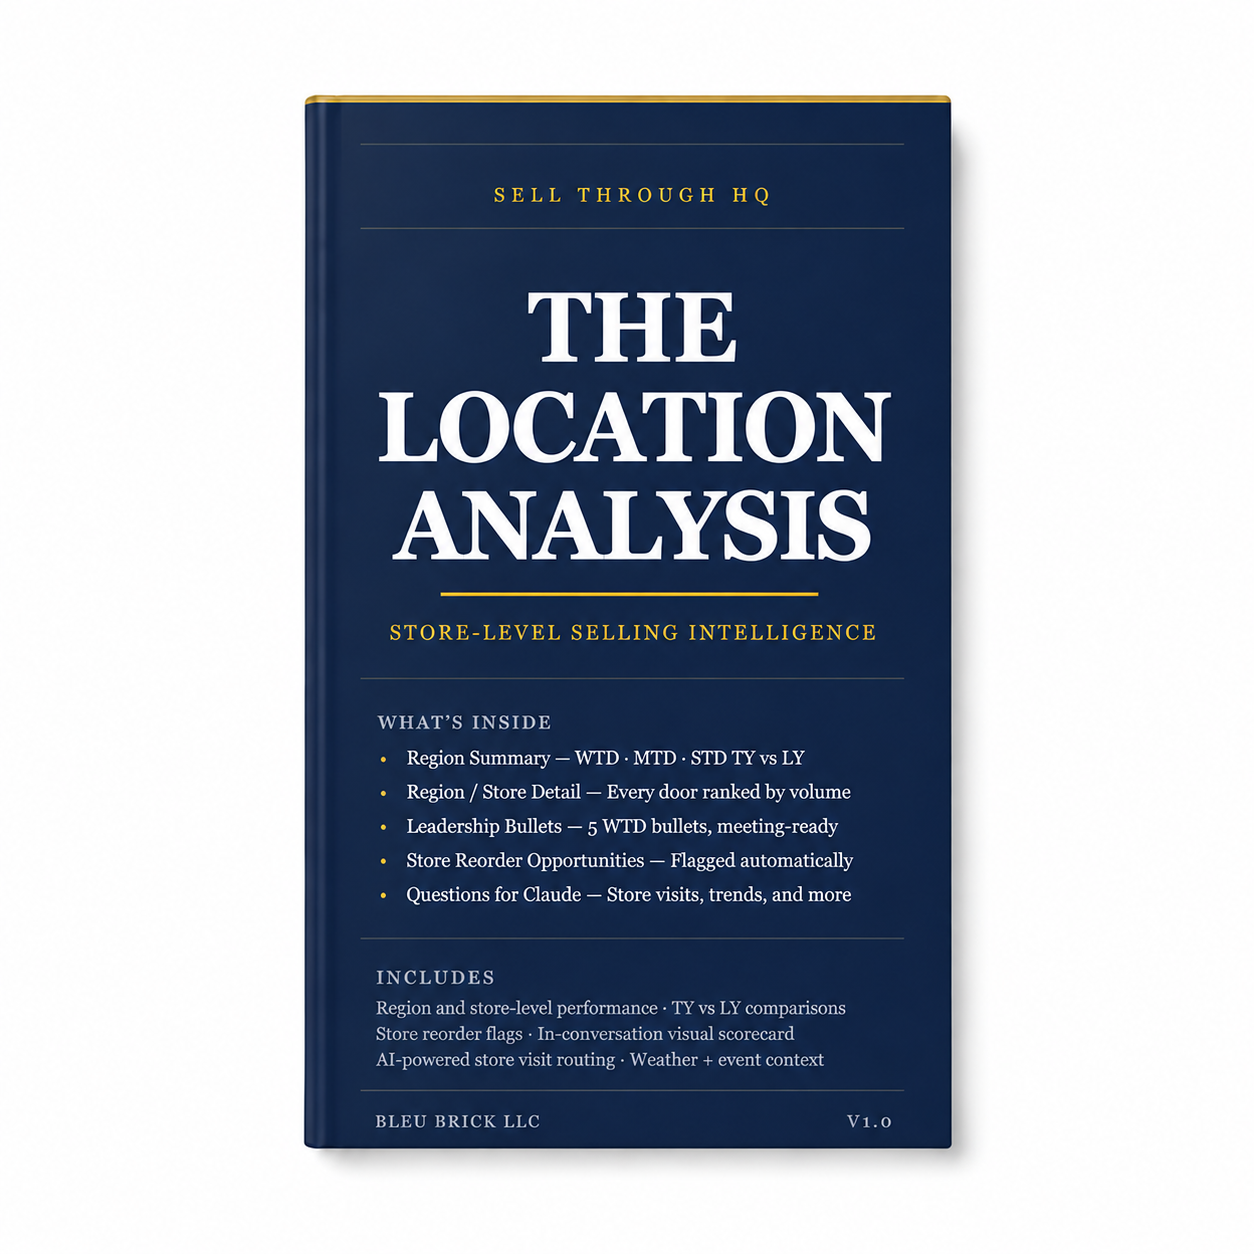
The Location Analysis is a store-level selling reprt for wholesale sales professionals managing accounts across multiple retail doors. Upload your weekly location report and receive a complete five-tab Excel workbook that breaks down performance by region and store -- ranked, flagged, and meeting-ready in minutes.
Know which regions are leading. Know which doors are outpacing last year. Know exactly where to send product and where to pull it.
What's included:
Region Summary -- WTD, MTD, and STD TY vs LY across all regions
Region / Store Detail -- every qualifying door ranked by last week's volume
Leadership Bullets -- five WTD bullets written for a head merchant
Store Reorder Opportunities -- doors selling above LY with stock below LY, flagged automatically
Questions for Claude -- store visit routing, seasonal trend direction, sales-to-stock ranking, and lowest ST% doors with live weather and local event context
Requires a Claude AI account. Claude Pro recommended.
HOW IT WORKS
Set up your account once: Create a Claude AI project for each wholesale account you manage. Upload Sell Through HQ template once into that project. It lives there permanently.
Upload your weekly report: Each week, open your account project and drop in your new selling report- Skypad export, retailer direct, or any standard Excel or CSV format.
Download your workbook: Claude reads your report against Sell Through HQ's merchandising logic and delivers a complete seven-tab Excel workbook in minutes. No prompting required.
SEE IT IN ACTION →
WORKS WITH
The reports already in your inbox.
SKYPAD
SHOPBOP
NORDSTROM
REVOLVE
SKYPAD
MACYS
BLOOMINGDALES
SKYPAD SHOPBOP NORDSTROM REVOLVE SKYPAD MACYS BLOOMINGDALES
-
"I am spending less time compiling data and more time actually understanding my business" - Account Execuitve
-
“These tools are helping my team understand their business quickly and actually make decisions that drive sales ” - VP, Wholesale
-
"Sell Through HQ reports should be the layer on top of everything else you use - A way to use AI that actually saves time .” - Sales Manager, Wholesale
ABOUT SELL THROUGH HQ
Sell Through HQ was built by someone who has done this job at every level- from start ups to nine-figure wholesale businesses, across accounts from Costco to Nordstrom. Every data point and summary system came from real selling data inside real accounts.
This is the tool we wished existed on Monday mornings.
The (very) Brief by Sell Through HQ
Five things. Five minutes. Delivered Sunday nights. Where retail meets AI (and other topics).
ALL PRODUCTS
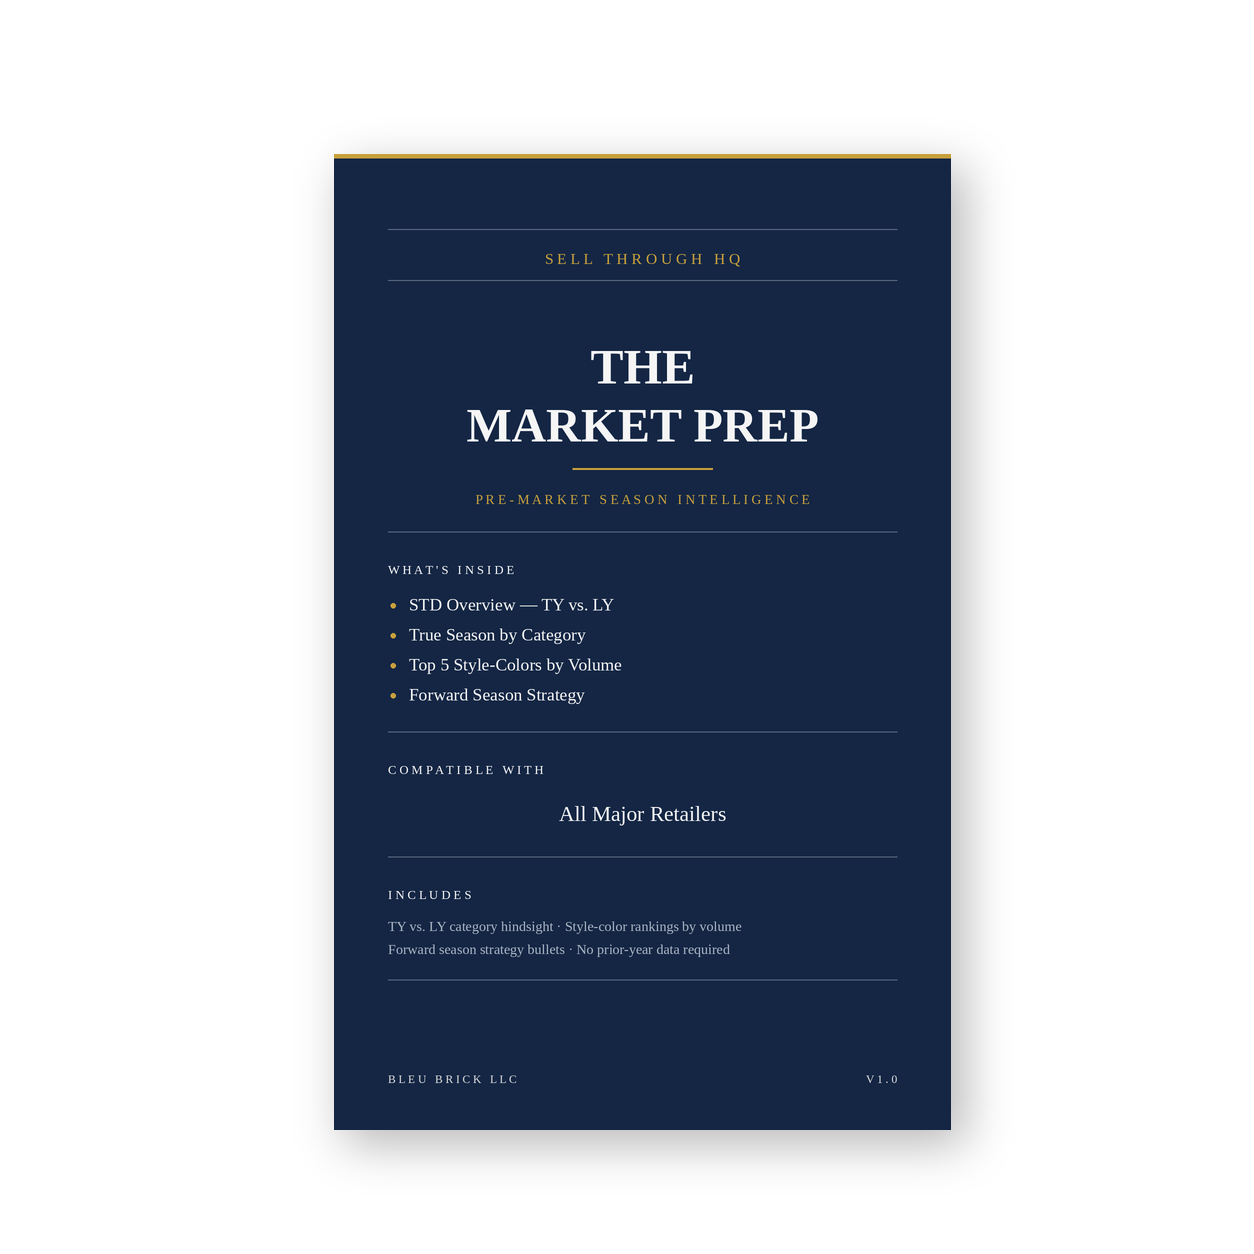
This PDF is a portable, self-contained prompt: upload it along with raw account exports and Claude follows it to clean, categorize, and calculate the data itself. It produces a single account-specific Excel workbook with six print-ready tabs covering season hindsight, season-to-date hindsight, top style-colors by category, and forward-looking strategy.
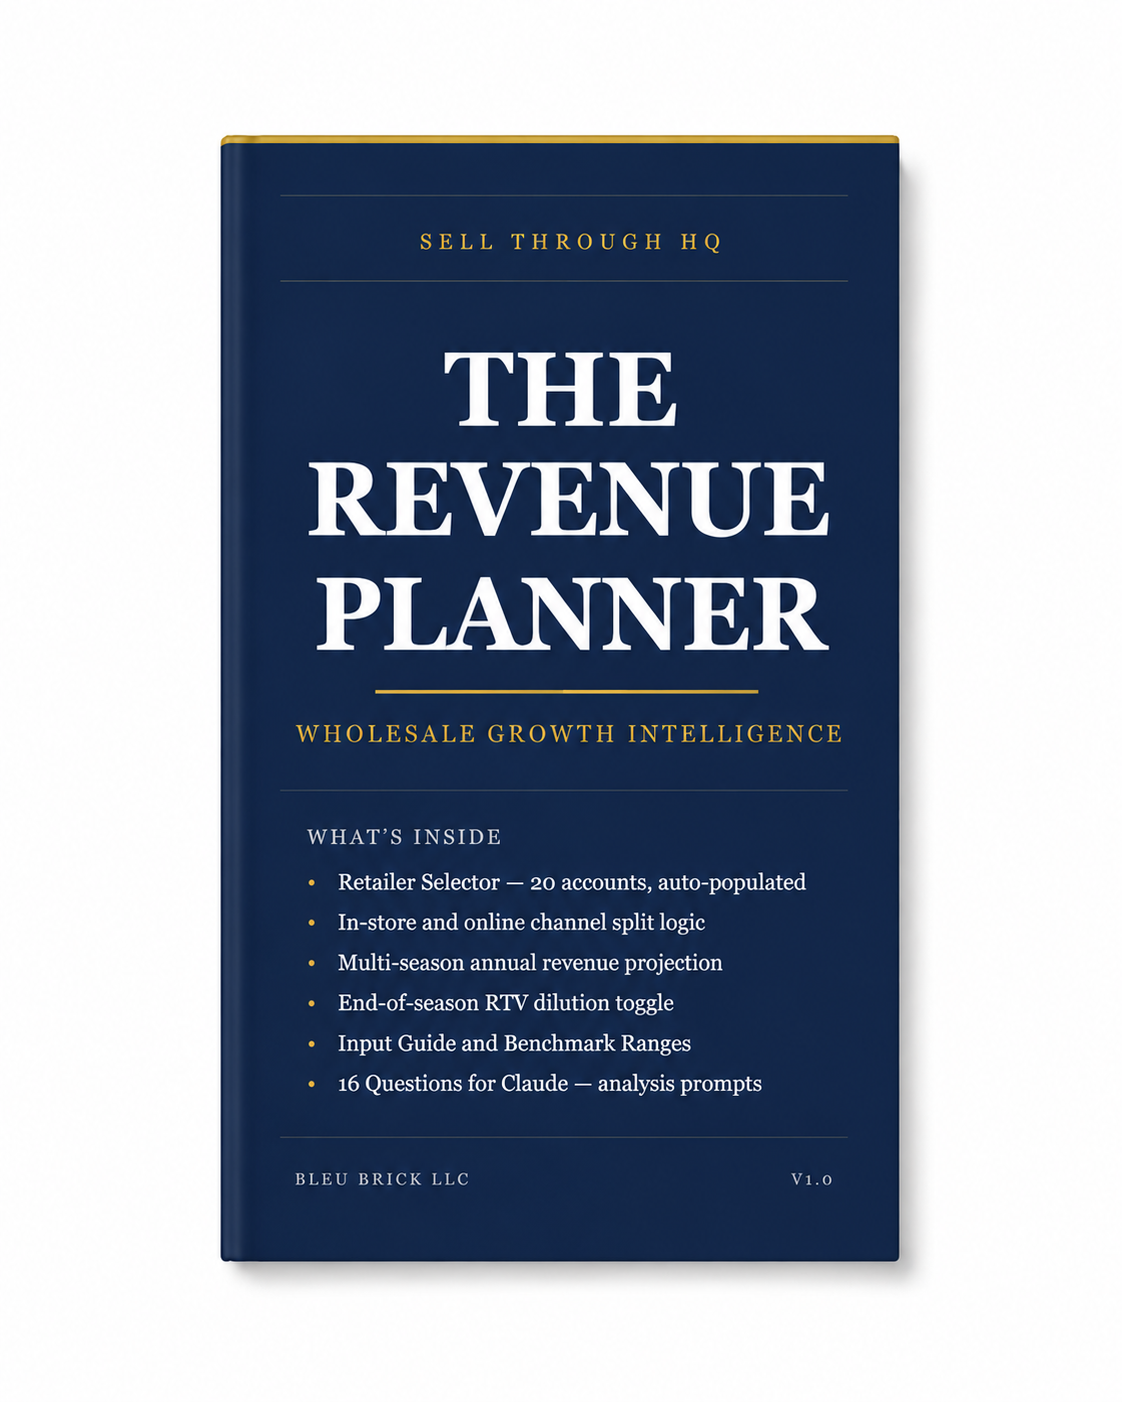
THE REVENUE PLANNER
You have a retailer in mind. You need to know if the numbers make sense.
The Revenue Planner is a structured Excel calculator that helps wholesale apparel brands size the revenue opportunity before walking into a buyer meeting. Select your target retailer, enter your brand inputs, and get a clear annual net wholesale revenue projection in minutes.
What's inside:
Retailer Selector -- 20 accounts across department store, off-price, pure-play online, subscription & rental, and specialty
Auto-populated door counts and retailer type for every account
Split input logic for in-store and online channels at department stores
End-of-season RTV toggle with adjustable dilution assumptions
Per-season and annual net wholesale revenue output
Input Guide & Benchmarks -- unit depth ranges by retailer type, SKU guidance, AUR and RTV context
Questions for Claude -- 16 prompts to sense-check your inputs, model scenarios, build your business case, and plan your next move
Built for sales directors and founders who need a number they can defend.
Requires Microsoft Excel or Google Sheets. Claude AI account recommended for Questions for Claude tab. Claude Pro preferred.
The Location Analysis is a store-level selling reprt for wholesale sales professionals managing accounts across multiple retail doors. Upload your weekly location report and receive a complete five-tab Excel workbook that breaks down performance by region and store -- ranked, flagged, and meeting-ready in minutes.
Know which regions are leading. Know which doors are outpacing last year. Know exactly where to send product and where to pull it.
What's included:
Region Summary -- WTD, MTD, and STD TY vs LY across all regions
Region / Store Detail -- every qualifying door ranked by last week's volume
Leadership Bullets -- five WTD bullets written for a head merchant
Store Reorder Opportunities -- doors selling above LY with stock below LY, flagged automatically
Questions for Claude -- store visit routing, seasonal trend direction, sales-to-stock ranking, and lowest ST% doors with live weather and local event context
Requires a Claude AI account. Claude Pro recommended.
THE WEEKLY STYLE SELLING REPORT
Upload your weekly style selling and receive a complete seven-tab Excel workbook that turns raw sell-through data into category analysis, style rankings, RTV flags, reorder opportunities, and five leadership-ready bullets -- automatically.
Know what sold. Know what didn't. Know your business better and faster than ever before.
What's included:
Category Analysis -- WTD, MTD, and STD TY vs LY across all categories
Full Style Data -- every style ranked by last week's dollar volume
RTV / Swap Candidates -- slow movers flagged against real sell-through thresholds
Reorder Candidates -- high-velocity styles ranked by weekly ST% with inventory still available
Leadership Bullets -- five WTD bullets written in merchant language, meeting-ready
Follow-Up Questions -- deeper analysis prompts for color selling, SKU concentration, markdowns, and more
Requires a Claude AI account. Claude Pro recommended.